[Date Prev] | [Thread Prev] | [Thread Next] | [Date Next] -- [Date Index] | [Thread Index] | [List Home]
Subject: Re: Office-3928
Hi Patrick,

Patrick Durusau schrieb am 15.05.2018 um 23:08:
Regina,

If you have time, can you review the changes I suggest to the resolution of:

https://issues.oasis-open.org/browse/OFFICE-3928

I think they are correct but since you authored the proposal, I wanted
to check with you first.
I will answer in the issue, but your last point there needs an example, therefore this mail.
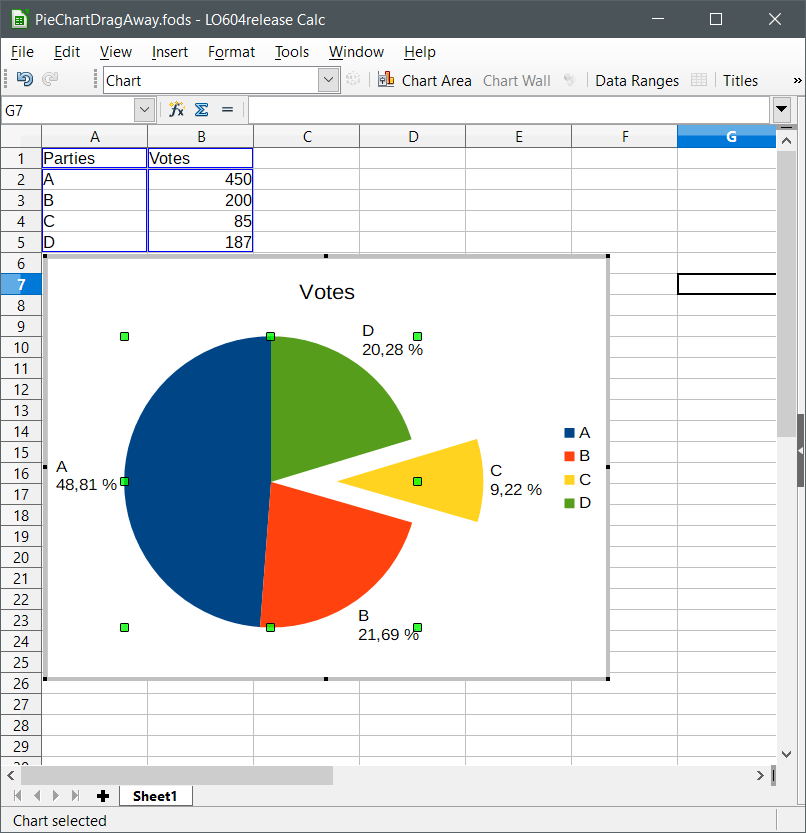
The screenshot shows a chart with a pulled out pie segment. The green handles mark the rectangle, which it given by the <chart:coordinate-region> element. A similar rectangle is given in Excel by the "plot area". I have attached an Excel file, where I have enabled the line for the "plot area", so that it is visible.
The element <chart:coordinate-region> defines a "positioning rectangle". The description uses the term "coordinate-region" and describes how this "coordinate-region" is build and how this "coordinate-region" is matched to the "positioning rectangle".
Kind regards
Regina
Attachment:
PieChartDragAway.ods
Description: application/vnd.oasis.opendocument.spreadsheet
Attachment:
ScreenshotEditmode.png
Description: PNG image
Attachment:
PieChartDragAwayByExcel.xlsx
Description: application/vnd.openxmlformats-officedocument.spreadsheetml.sheet
[Date Prev] | [Thread Prev] | [Thread Next] | [Date Next] -- [Date Index] | [Thread Index] | [List Home]