I guess I don’t understand the question. But that hasn’t stopped me before from putting in my 2 cents.
I thought the CSP’s earned their profit by buying curtailment in the retail market and selling it at a profit into the wholesale market. I think you folks should visit the Board of Trade in Chicago and learn how the big boys do it. Don’t forget to bring your checkbooks.
And don’t worry, it’s not as wild and wooly as it used to be. They’ve stopped dropping truckloads of corn on the unlucky speculator’s front lawn in suburban Highland Park.
Best,
B.O. April 29, 2011
Robert Old
Siemens Industry, Inc.
Building Technologies
1000 Deerfield Pkwy.
Buffalo Grove, IL 60089-4513
Tel.: +1 (847) 941-5623
bob.old@siemens.com
usa.siemens.com/buildingtechnologies
From: Holmberg, David [mailto:david.holmberg@nist.gov]
Sent: Friday, April 29, 2011 8:27 AM
To: 'Gowri, Krishnan'; energyinterop@lists.oasis-open.org
Subject: [energyinterop] EI feedback
Just a note—I was looking at a recent PJM white paper on price responsive demand:
http://pjm.com/~/media/documents/reports/pjm-whitepaper-on-price-responsive-demand.ashx
PJM is stressed about not being able to correctly model price responsive demand (PRD) and thus wants info back from the customer. From page 11-12 I quote (and have highlighted what they expect from the facility). This is the only place I know where I have seen written down a request for feedback in some format. The PRD Provider would be someone like an ESP or CSP.
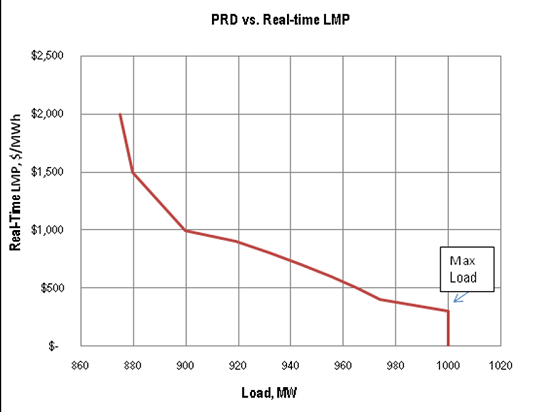
“In real-time operations, it is essential to understand how much energy will be consumed at or above various prices so that PJM can send out the proper price and dispatch signals to market participants to maintain energy balance and reliability. Without this information PJM may be in a position of ―over- or under-dispatching‖ resources, rather than dispatching the amount necessary to maintain energy balance. The PRD curves submitted by the PRD Provider, which include price-quantity pairs, enable short-term load forecasting to account for reactions to dynamic retail rates. The below figure illustrates what such a PRD curve might look like. PJM Staff Whitepaper Price Responsive Demand March 3, 2011 DOCS# 591114 PJM © 2011 Page 12
David Holmberg
NIST Engineering Laboratory
301-975-6450