[Date Prev] | [Thread Prev] | [Thread Next] | [Date Next] -- [Date Index] | [Thread Index] | [List Home]
Subject: surface charts
I have attached 3 files:
a gnumeric file with a contour and a surface plot
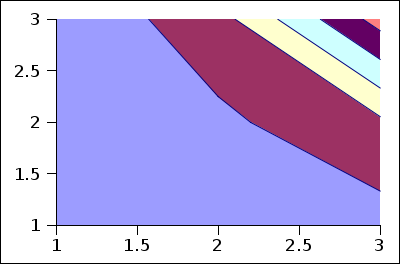
a PNG showing the contour plot
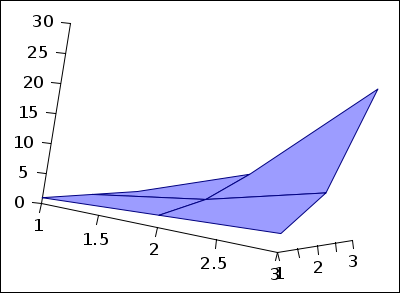
a PNG showing the surface plot
In all three cases the data comes from the region:
A B C D
R1 1 2 3
R2 1 1 2 3
R3 2 1 4 9
R4 3 1 8 9
intended as a 3 by 3 surface with the height values contained in
Sheet1.$B$2:Sheet1.$D$4
Gnumeric stores the surface plot in an ODS file as
<office:chart>
<chart:chart svg:width="152.00pt" svg:height="101.00pt" chart:class="chart:surface" chart:style-name="plotstyle">
<chart:plot-area chart:style-name="plotarea" table:cell-range-address="Sheet1.$A$2:Sheet1.$A$4">
<chart:axis chart:dimension="z" chart:style-name="zaxis"/>
<chart:axis chart:dimension="y" chart:style-name="yaxis"/>
<chart:axis chart:dimension="x" chart:style-name="zaxis"/>
<chart:series chart:values-cell-range-address="Sheet1.$B$2:Sheet1.$D$4" chart:style-name="series1">
<chart:domain table:cell-range-address="Sheet1.$A$2:Sheet1.$A$4"/>
<chart:domain table:cell-range-address="Sheet1.$B$1:Sheet1.$D$1"/>
</chart:series>
<chart:wall svg:width="152.00pt" chart:style-name="wallstyle"/>
</chart:plot-area>
</chart:chart>
</office:chart>
with
<style:style style:name="plotstyle" style:family="chart">
<style:chart-properties chart:auto-size="true" chart:three-dimensional="true"/>
</style:style>
Similarly the contour chart is
<office:chart>
<chart:chart svg:width="152.00pt" svg:height="86.75pt" chart:class="chart:surface" chart:style-name="plotstyle">
<chart:plot-area chart:style-name="plotarea" table:cell-range-address="Sheet1.$A$2:Sheet1.$A$4">
<chart:axis chart:dimension="y" chart:style-name="yaxis"/>
<chart:axis chart:dimension="x" chart:style-name="zaxis"/>
<chart:series chart:values-cell-range-address="Sheet1.$B$2:Sheet1.$D$4" chart:style-name="series1">
<chart:domain table:cell-range-address="Sheet1.$A$2:Sheet1.$A$4"/>
<chart:domain table:cell-range-address="Sheet1.$B$1:Sheet1.$D$1"/>
</chart:series>
<chart:wall svg:width="152.00pt" chart:style-name="wallstyle"/>
</chart:plot-area>
</chart:chart>
</office:chart>
with
<style:style style:name="plotstyle" style:family="chart">
<style:chart-properties chart:auto-size="true" chart:three-dimensional="false"/>
</style:style>
Note that this way of storing surface plots would allow a program to add several surfaces to the same plot by adding multiple series.
Andreas
--
Andreas J. Guelzow
Concordia University College of Alberta
[Date Prev] | [Thread Prev] | [Thread Next] | [Date Next] -- [Date Index] | [Thread Index] | [List Home]